An excellent tweet from Andrew Usher – a Canadian rugby fan and economist who has a locked Twitter account for sensible professional reasons – asks whether red cards are more common in the later stages of rugby games.
A basic rational crime model would suggest they should be. Committing red-card-worthy offences can be helpful to a team – they can save tries, intimidate the opposition, or put important players out of the game. None of these are consistent with the spirit of rugby, but they may help to win. Conditional on getting caught, the cost of committing such an offence goes down as the game goes on. Whenever you commit the offence, you get a 2-week suspension, but if you commit it in the 5th minute of the game, your team is down a player for 75 minutes. By contrast, if you commit it in the 75th minute, your team is only down a player for 5 minutes. The rewards, by contrast, don’t go down as quickly: Intimidating the other team or removing a player is less valuable with less game time remaining, but, ignoring momentum effects, a try saved by cynical play in the 75th minute has just as much effect on the final score as one saved in the 5th. Thus, assuming that the probability of being caught is constant throughout the game, the number of red cards-per-minute should increase as the game goes on.
One cautionary note is that referees may be more willing to give red cards later in the game, because they are worried about ‘ruining the game’ if they give them earlier. Thus, if we do observe this increase in red-card rates over the game, it could be partially driven by referee reticence. This is probably less of a problem with more recent data, as strict World Rugby rules about dangerous play have significantly reduced referees’ discretion, at least in the professional game, about when cards are to be awarded.
This question is important because World Rugby is currently considering 20-minute red cards. There are suggestions that this might lead to more foul or dangerous play. For that to be true, rugby teams need to respond rationally to incentives created by carding rules. Shifting the time of foul play around to minimize the cost of a card would reveal that teams do engage in such strategic behaviour.
As a former (perhaps, future too) rugby referee (and definitely former player), former and future economics student, general data nerd, and big fan of the film Moneyball, this question is exactly at the intersection of my interests. So lets see what the answer is.
Rugby World Cups
The first data relevant to this question that I could find was on Wikipedia. A page there records the details of the 25 red cards given at mens Rugby World Cups. Here’s what a histogram of this data looks like:
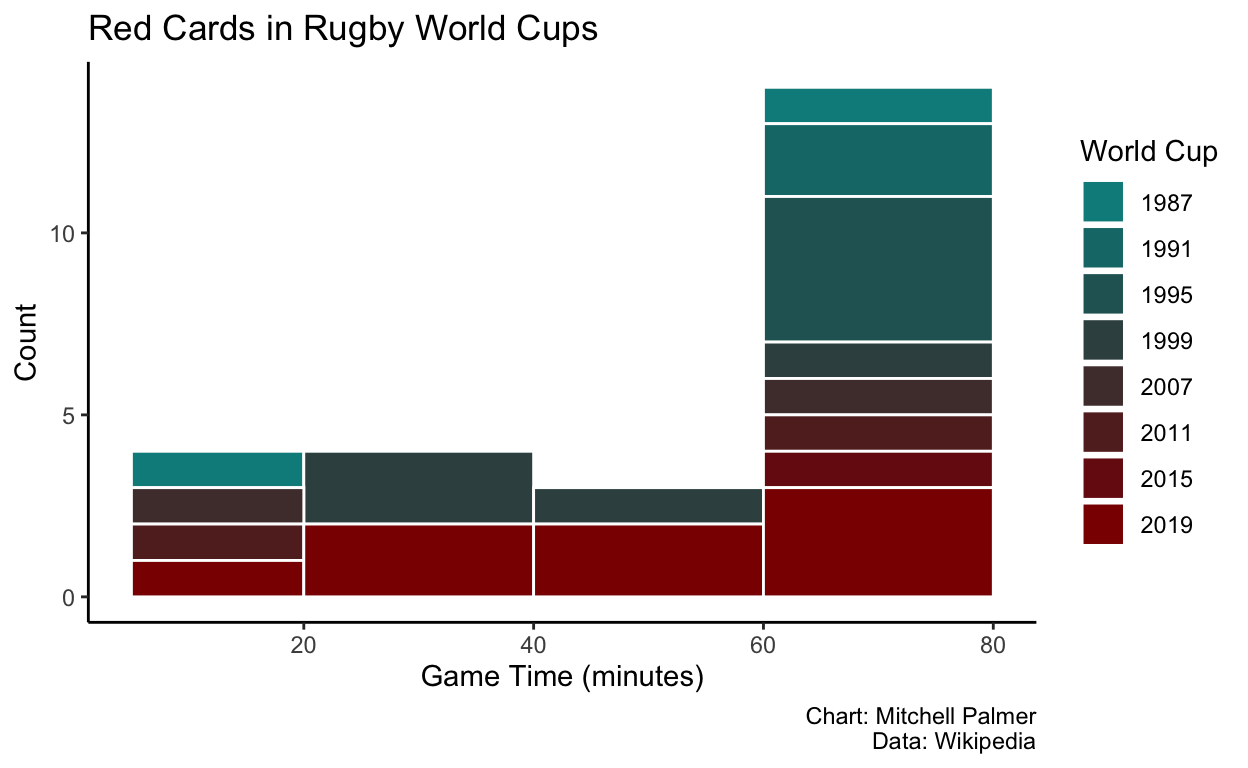
This provides some initial evidence that red cards typically come later in the game. That could suggest strategic behaviour by teams. However, Rugby World Cups are almost certainly not representative of most rugby that is played.
Other Rugby
Unfortunately, there is a dearth of good publicly-available granular rugby data. The closest we can get to times for red cards is whether yellow cards are in the first or second half. Given yellow cards don’t come with an automatic suspension period, they might be expected to be more sensitive to changes in the effective cost of in-game punishments. However, because they are already time-limited, we would only expect to see an effect in the last 10 minutes of the game, as any yellow card received before then would always have a duration of 10 minutes. So, we would expect teams to generally get slightly more yellow cards in the second half, in an effect driven by the last 10 minutes.
To provide a reasonable contrast with the RWC example, I’ve chosen to use data from the 2020 season of the ITM Cup, New Zealand’s professional domestic competition, from Statbunker.
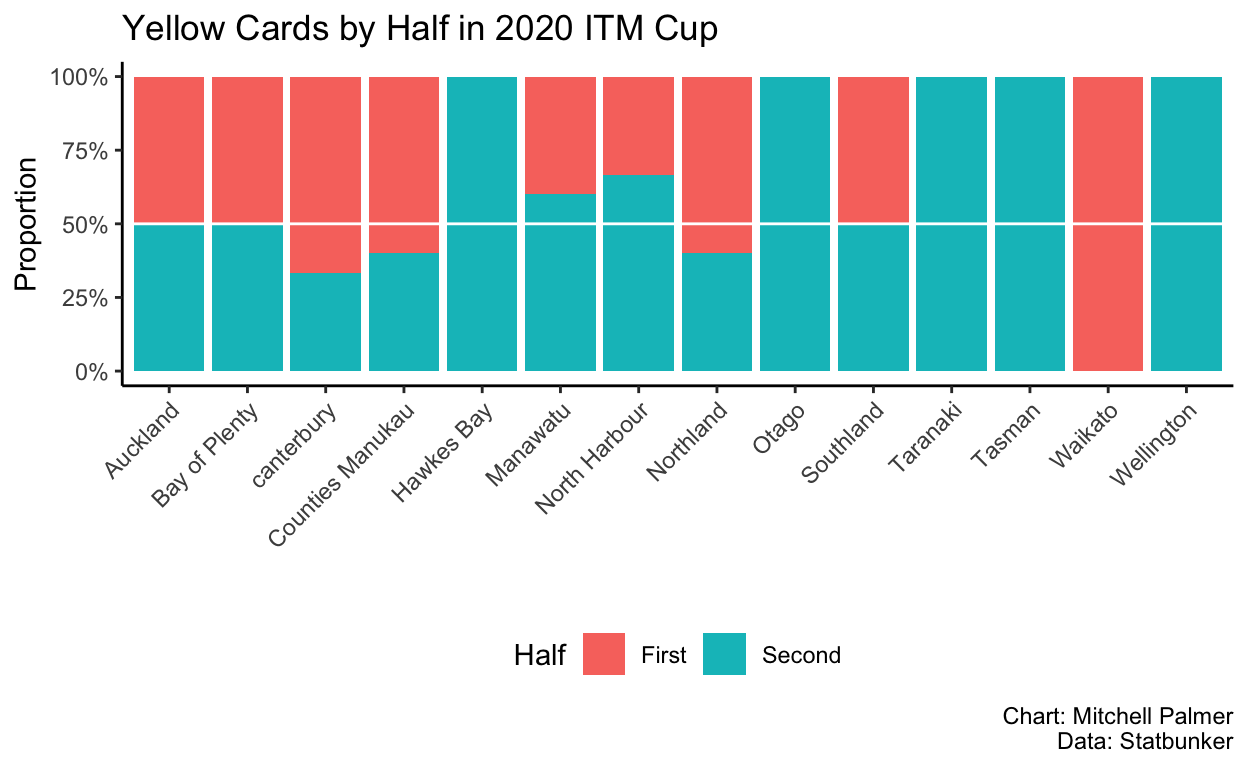
The relatively small number of yellow cards given across the entire season means it is difficult to divine much of a trend, but getting more yellow cards in the second half is far from a universal phenomenon. Nonetheless, adding together all of the yellow cards received across provinces, we get a breakdown like this:
| Half | Total Cards | Proportion |
|---|---|---|
| First | 19 | 40.4 |
| Second | 28 | 59.6 |
This suggest there is a somewhat strong pattern of more cards being given in the second half. Given that giving a yellow card doesn’t come with the same ‘game-ruining’ prospects, the likelihood of this being driven by referee reticence is lower than in the case of red cards. Some of this variation may be driven by exhaustion leading to sloppier and more dangerous play, but some may also be driven by strategy.
Conclusion
There isn’t much here. It is only a small number of cards examined in a very limited subset of rugby. But I think this is interesting suggestive evidence that teams behave strategically and respond to the incentives created by card rules. That might be a warning against loosening red card rules. In the future, I may expand this analysis using the data available on other non-New Zealand and non-international leagues, but for now, I think it suffices as a proof-of-concept.